Charts / infographics / traffic building
At EstateVue we have developed real-time charts, graphics, and combination listing tool infometrics powered by AI, human insights, and complex data systems. The tools are generated by easy to use JavaScript embed codes that can be integrated into any website platform. Some charts can be setup to drive traffic, with the core purpose of providing useful, interactive elements that help your users to find unique real estate insights in Canada. Other charts are purely informational, but are kept updated by us so the data never goes stale. These rich media elements are important for SEO, improving return visitation, and many other crucial aspects of having a Realtor website. Below are some of our more popular charts. If you are interested in a custom chart being made for your company, please contact us.
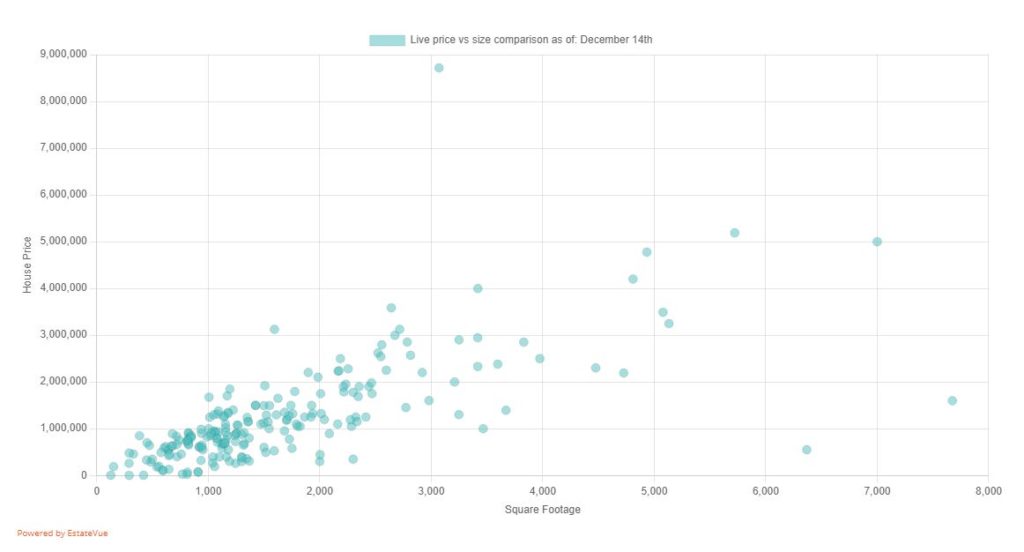
PRICE vs SIZE
The chart visually represents the relationship between property size, measured in square footage (SQFT), and corresponding prices in an informative manner. Each data point on the scatterplot represents a specific property, with the X-axis denoting the square footage of the property, and the Y-axis indicating its corresponding price.
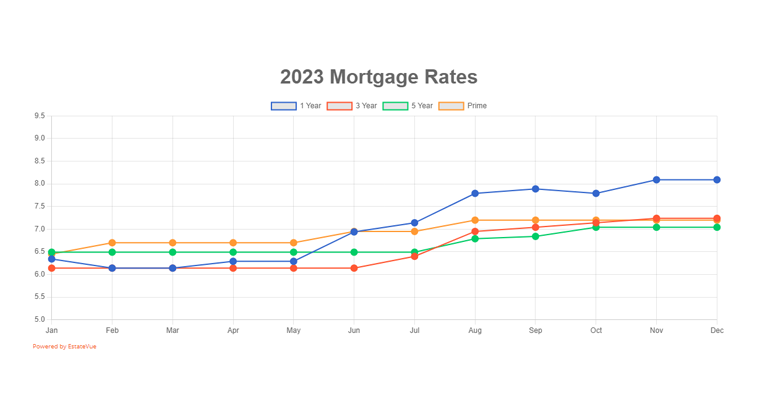
CURRENT MORTGAGE RATES
A real-time updated chart showcasing average interest rates posted by major chartered banks in 2023 offers a dynamic and responsive tool for users seeking the latest financial insights. This real-time functionality ensures that viewers have immediate access to the most current interest rate data, enabling them to make informed decisions promptly.
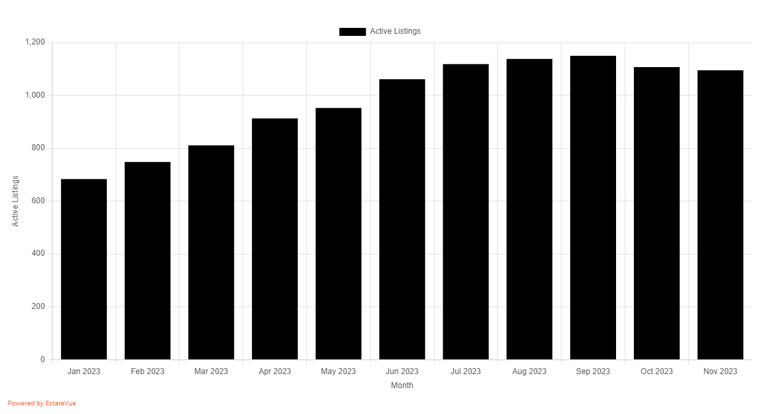
regional monthly active listings
Integrating a real-time chart of active listings on a realtor website goes beyond providing mere snapshots of the current real estate market.
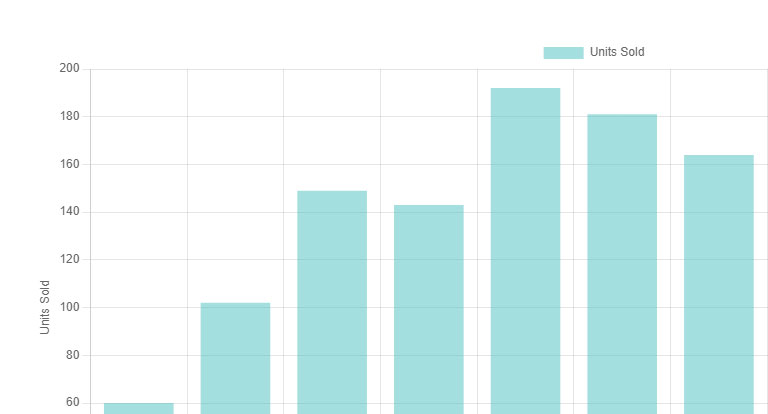
REGIONAL UNITS SOLD
Help potential buyers and sellers understand the current demand and activity in the real estate market, fostering a sense of confidence in your expertise.
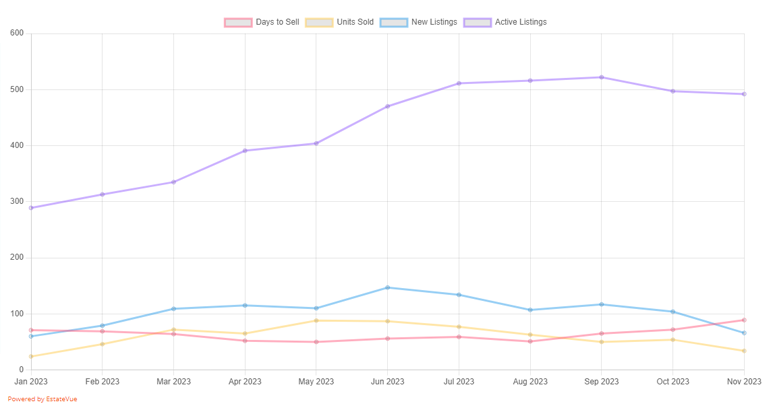
DAYS TO SELL, UNITS SOLD, NEW + ACTIVE LISTINGS
The easy to embed JavaScript code generates a dynamic line chart for any Realtor’s website. It has been designed to visually represent crucial real estate metrics and it is updated on a monthly basis by us. The chart displays trends in sales volume, days to sell, units sold, new listings, and active listings.
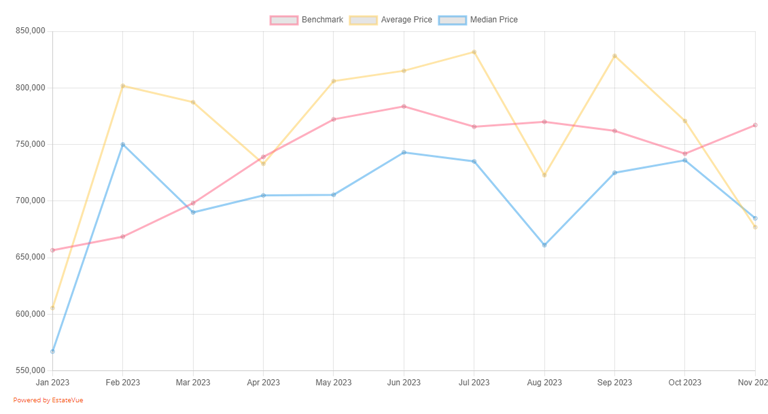
AVERAGE / BENCHMARK / MEDIAN PRICE
This chart displays all single family units for each month of the year, compared to bencmark price, average price, and median price. ** Benchmark Price is an estimated sales price of a benchmark property. A benchmark property is a standard or yardstick property within the target area.
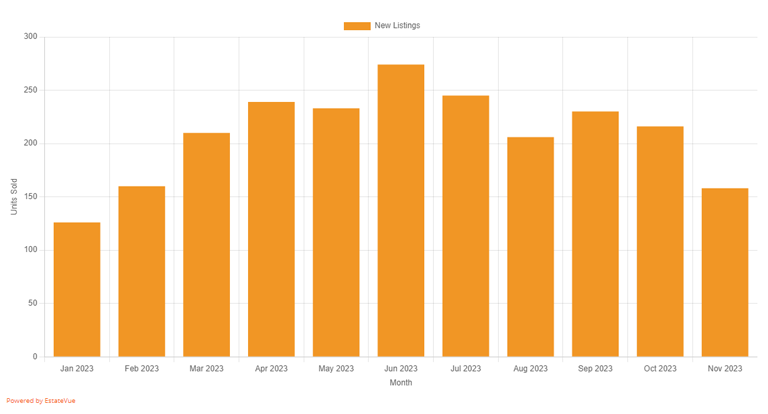
regional NEW listings
Incorporating a real-time historical record of new active listings on a website serves as a pivotal tool for providing visitors with immediate and continuous insights into the present state of real estate activity within a designated area.
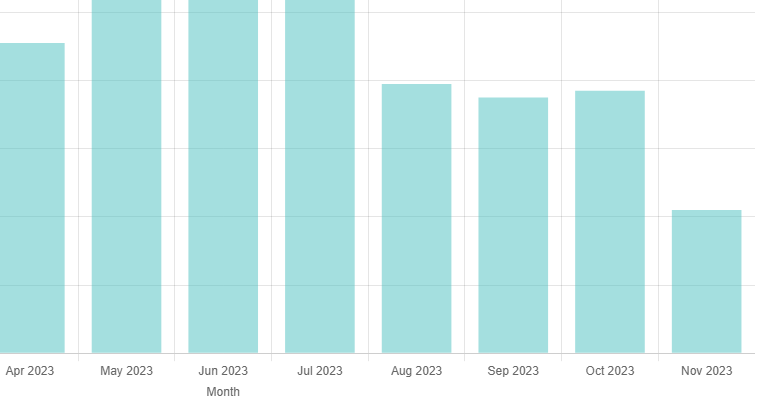
REGIONAL SALES VOLUMES
Displaying monthly sales volumes on a realtor website is immensely beneficial as it provides a succinct and data-driven overview of the real estate market’s performance. This dynamic feature enables visitors to discern trends, identify peak seasons, and more.
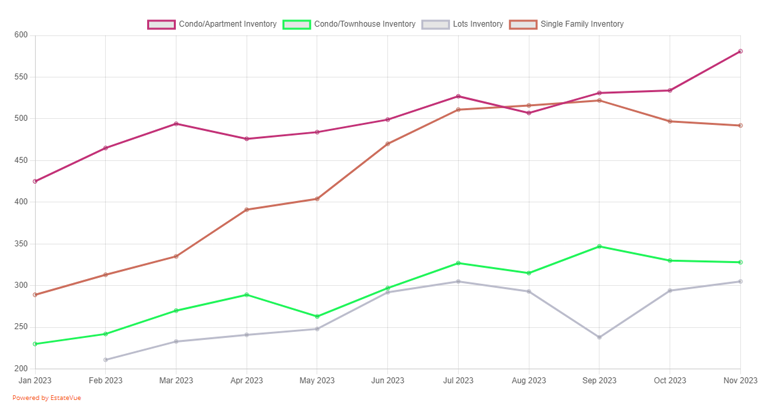
INVENTORY LEVELS ACROSS PROPERTY TYPES
Introducing a multiline report that measures inventory levels across different property types on a realtor website provides valuable insights and benefits for both real estate professionals and prospective clients.
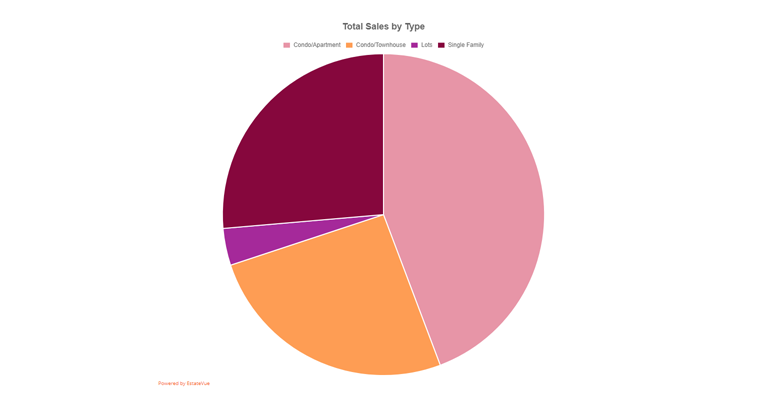
Total YEARLY Sales by Type
The effortlessly embeddable JavaScript code produces a dynamic pie chart tailored for any Realtor’s website, offering a visual representation of the total sales by type in any given region.


 Mon-Fri: 8:30-5:00
 #7 3185 Via Centrale, Kelowna BC


